The Cleveland Museum of Art is a world-renowned art museum with a substantial collection of over 61,000 artworks. In January of 2019, they launched their Open Access Initiative in which they made over 30,000 public domain works and metadata for their entire collection public and downloadable (GitHub). Metadata includes title, description, artist, year, and department, among other details. As part of the Open Access launch, CMA asked Pandata to participate in demonstrating the power of such a data set. Using natural language processing and data visualization techniques, Pandata used the text descriptions from all art that had one (approximately 10,000 works) to visualize how we write about art across time and cultures.
Each dot corresponds to a piece of artwork in the collection. The department is indicated by color. We took the description of the art and used an algorithm that converts each text to numbers based on the words in the text (Word2Vec). This algorithm “learns” the text and assigns numbers based on the words. The more similar the text, the more similar the numbers. For example, “blue” and “purple” will be closer together than “blue” and “chair”. Then, we used a visualization algorithm, t-SNE (or t-Distributed Stochastic Neighbor Embedding) that takes high-dimensional sequences of numbers and groups them together in a two-dimensional graph. t-SNE finds
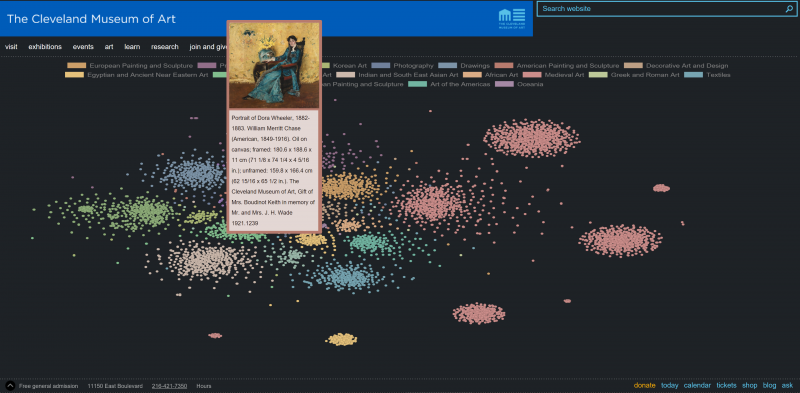
This interactive graphic also acts to visualize a large portion of the CMA collection simultaneously. Hovering over each dot
The patterns uncovered in the art metadata reveal interesting trends in how art is discussed. Largely, artworks in the same department cluster together, as department was also used in the clustering. However, the exceptions are very telling. For example, one work from “Greek and Roman Art” (a statue) department is next to one from “Prints”. The two works were created over a thousand years apart. However, the text description of both discuss Apollo, music, and animals, resulting in the two pieces being colocalized. Additionally, the relative placing of departments lays out like a map of the world in geography and time. In the center is ancient Greek and Roman art and Egyptian art. Islamic art blends into South Asian and then into East Asian art. European and American art is on the opposite side.
Using machine learning and visualization techniques, Pandata developed a way to simultaneously explore approximately 10,000 art works spanning thousands of years and cultures from the comfort of your computer, giving significant insight into the way we write about art. More generally, metadata made accessible to all by CMA allows for